

Methods
1. Calibration of the in-plane PFM response by the lateral force curves
The quantification of signals captured in the piezoresponse force microscopy (PFM) measurements needs calibration procedure allowing to confront signal registered by the optical beam detection (OBD) scheme of the atomic force microscope (AFM) with the real lateral displacement of the surface coupled with the tip (sensitivity calibration). Quantification of the vertical cantilever displacement is usually performed by the measurements of the force-distance curves in the quasi-static regime. A standard approach for the lateral cantilever calibration has not been developed yet. One of the practical ways to do the lateral calibration is based on the lateral force curves measurements, where tip being forced against the surface moves in the lateral direction. This method is easy, doesn’t need any complicated schemes and devices, and assumes the possibility of the sensitivity calibration immediately before and after PFM measurements.
The lateral force-distance curves are measured by scanning a small area of the sample 10-50 nm in the direction perpendicular to the long side of the cantilever in the standard contact mode of atomic force microscopy (Fig. 1a). At the beginning of the movement, the probe is coupled with the surface, which is determined by the presence of static friction force (Fig. 1a). The movement of the cantilever leads to the torsional bending of the cantilever (twisting) accompanying with the change of the OBD lateral signal. The coefficient between the lateral distance and OBD lateral signal in the linear sticking region (Region 2 on Fig. 1a) reflects the sensitivity of the system and can be used to calibrate the cantilever (Fig. 1a). The cantilever sensitivity extracted from the lateral force curves doesn’t depend on the probe velocity and weakly depends on the applied force (Fig. 1b). The choice of the correct loading force reduces the region of the non-linearity and increases the linear region being used for the calibration (Fig. 1b). The calculated relative error was below 5%, which is closed to the typical error of the vertical PFM signal calibration procedure based on the force-distance curves. A detailed description of the lateral calibration procedure was published in the Ferroelectrics journal and available in the Publications section.
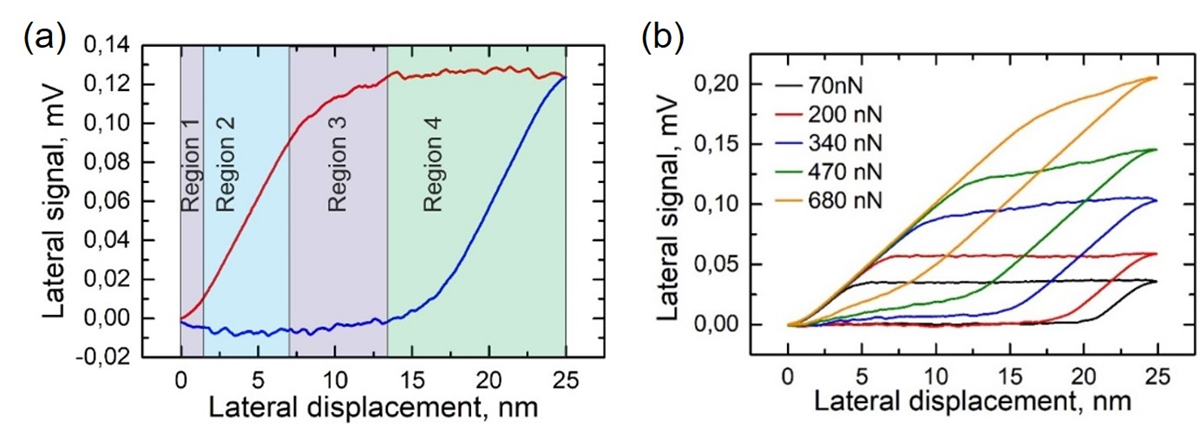
Figure 1. (a) Lateral force curves measured on LN surface at forward (red) and backward (blue) passes. The regions of the different signal behavior corresponding to forward pass are depicted and numbered: region 1 – non-linear sticking regime, region 2 – linear sticking regime, region 3 – non-linear stick-sliding regime, region 4 – sliding regime corresponding to normal scanning, (b) Lateral force curves acquired with various normal loading forces.
2. In-plane polarization contribution to the vertical piezoresponse force microscopy signal mediated by the cantilever “buckling”
A rigorous experimental/theoretical approach to measure and minimize in-plane piezoresponse contribution to the vertical piezoresponse force microscopy (PFM) signal is introduced. The in-plane piezoresponse mediated by the cantilever “buckling” is shown to affect the apparent vertical PFM signal being of the same order of magnitude as a true out-of-plane piezoresponse. We found that the common set-up of the PFM mode with the laser beam focused close to the cantilever free end is susceptible to the combination of the in-plane and out-plane piezoresponses. Therefore, the vertical piezoresponse phase depends on the in-plane orientation of the polarization in the individual grains and domains. Decoupling of the out-of-plane and in-plane contributions based on a simple mathematical procedure is demonstrated. Additionally, the row PFM data are analyzed as a function of the laser beam focus position on the cantilever and the position allowing suppressing the “buckling” contribution and hence measuring only the out-of-plane piezoresponse component is revealed (Figure 1). The suggested method is described within the developed theoretical model of the cantilever vibrations, which provides a simple and useful framework for predicting sensitivity to the buckling cantilever vibrations of the cantilever with chosen geometrical parameters. The approach can be used for the accurate recovery of the piezoresponse displacement vector, which is of paramount importance for the reconstruction of the domain structures and quantitative characterization of the polarization distribution and local piezoelectric properties in ferroelectric materials. A detailed investigation was published in the Applied Surface Science journal and available in the Publications section.
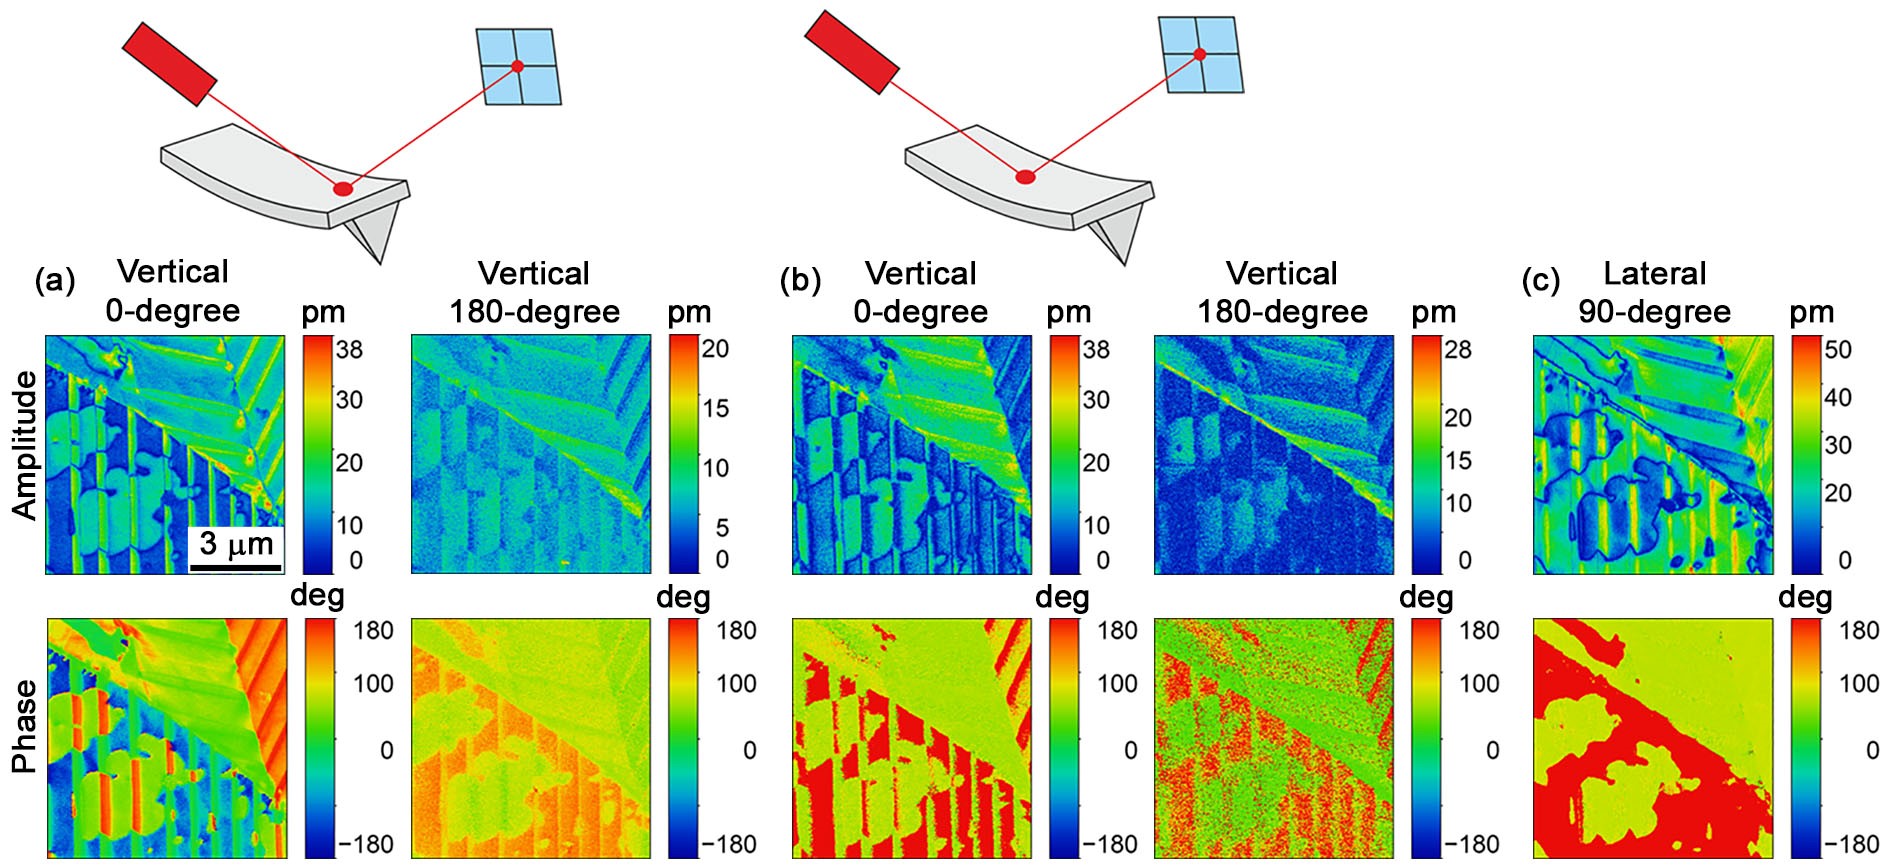
Figure 1. PFM amplitude and phase images with the optical beam deflection laser focused: (a) near the cantilever free end, (b) close the cantilever middle. (c) Lateral PFM images of the same region for the 90°-rotated sample orientation